The Hidden Emissions
of Electric Vehicles

MIMS 2023 Capstone Project
by Astoria, Clara, and Josh
Emissions Explorer

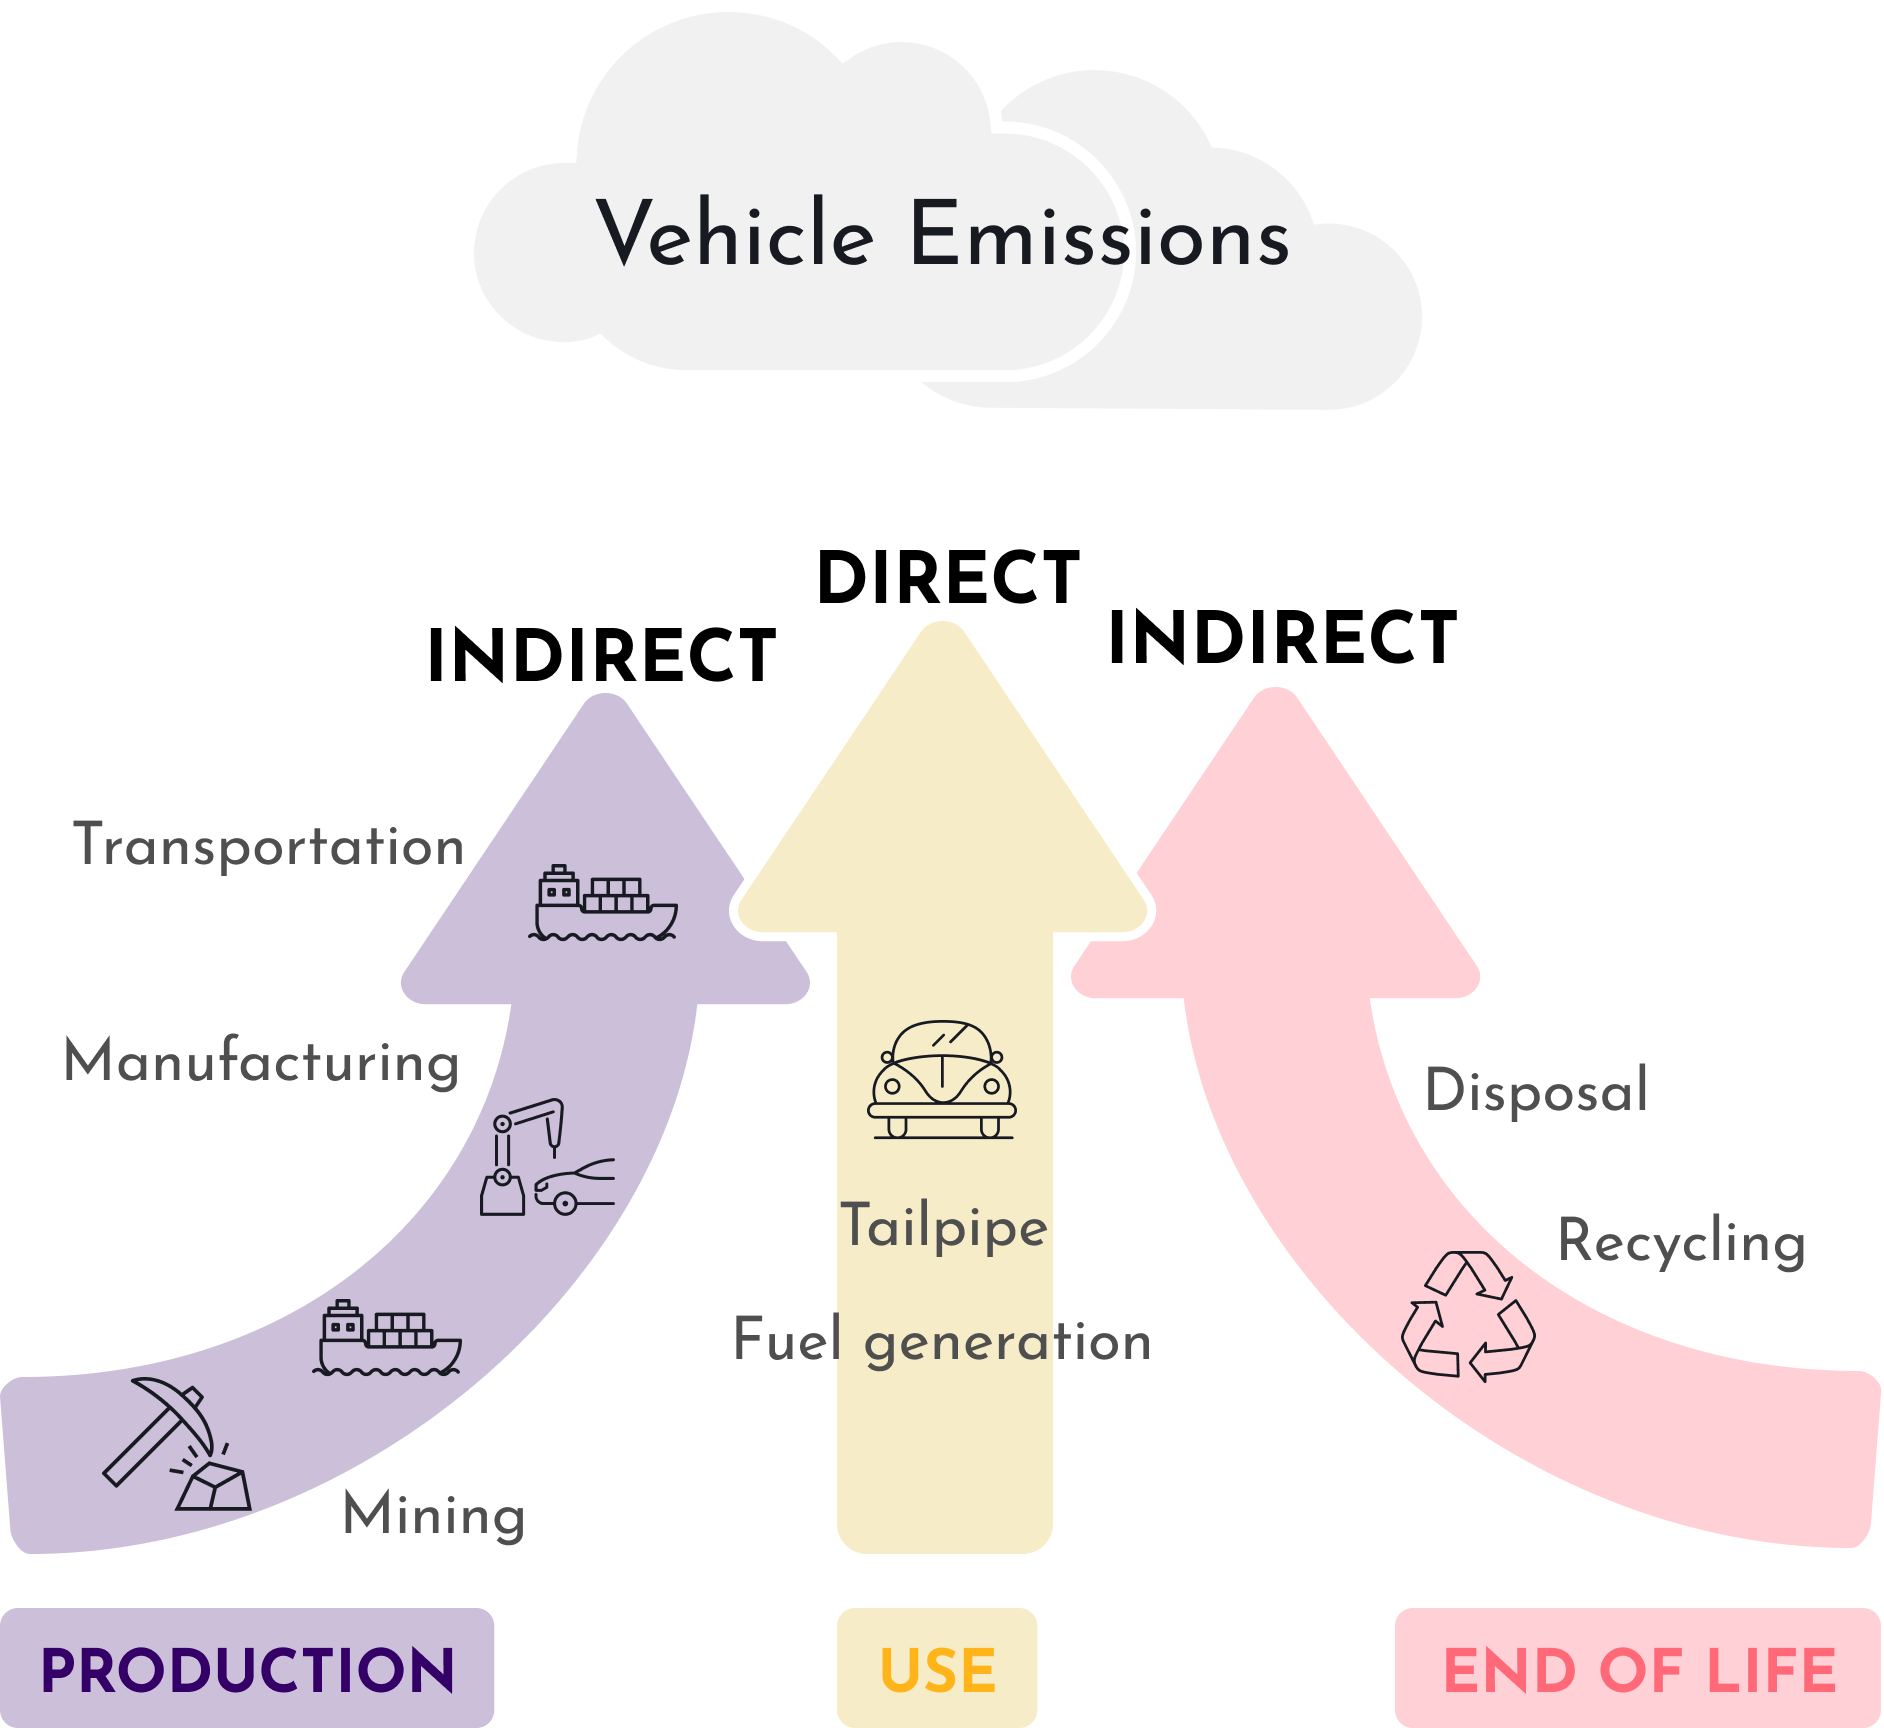
Transportation is the largest contributor to emissions.

Emissions from transportation includes everything around the movement of people or goods from place to place. This covers emissions from passenger driving and flying as well as from freight services importing and exporting raw materials and products.

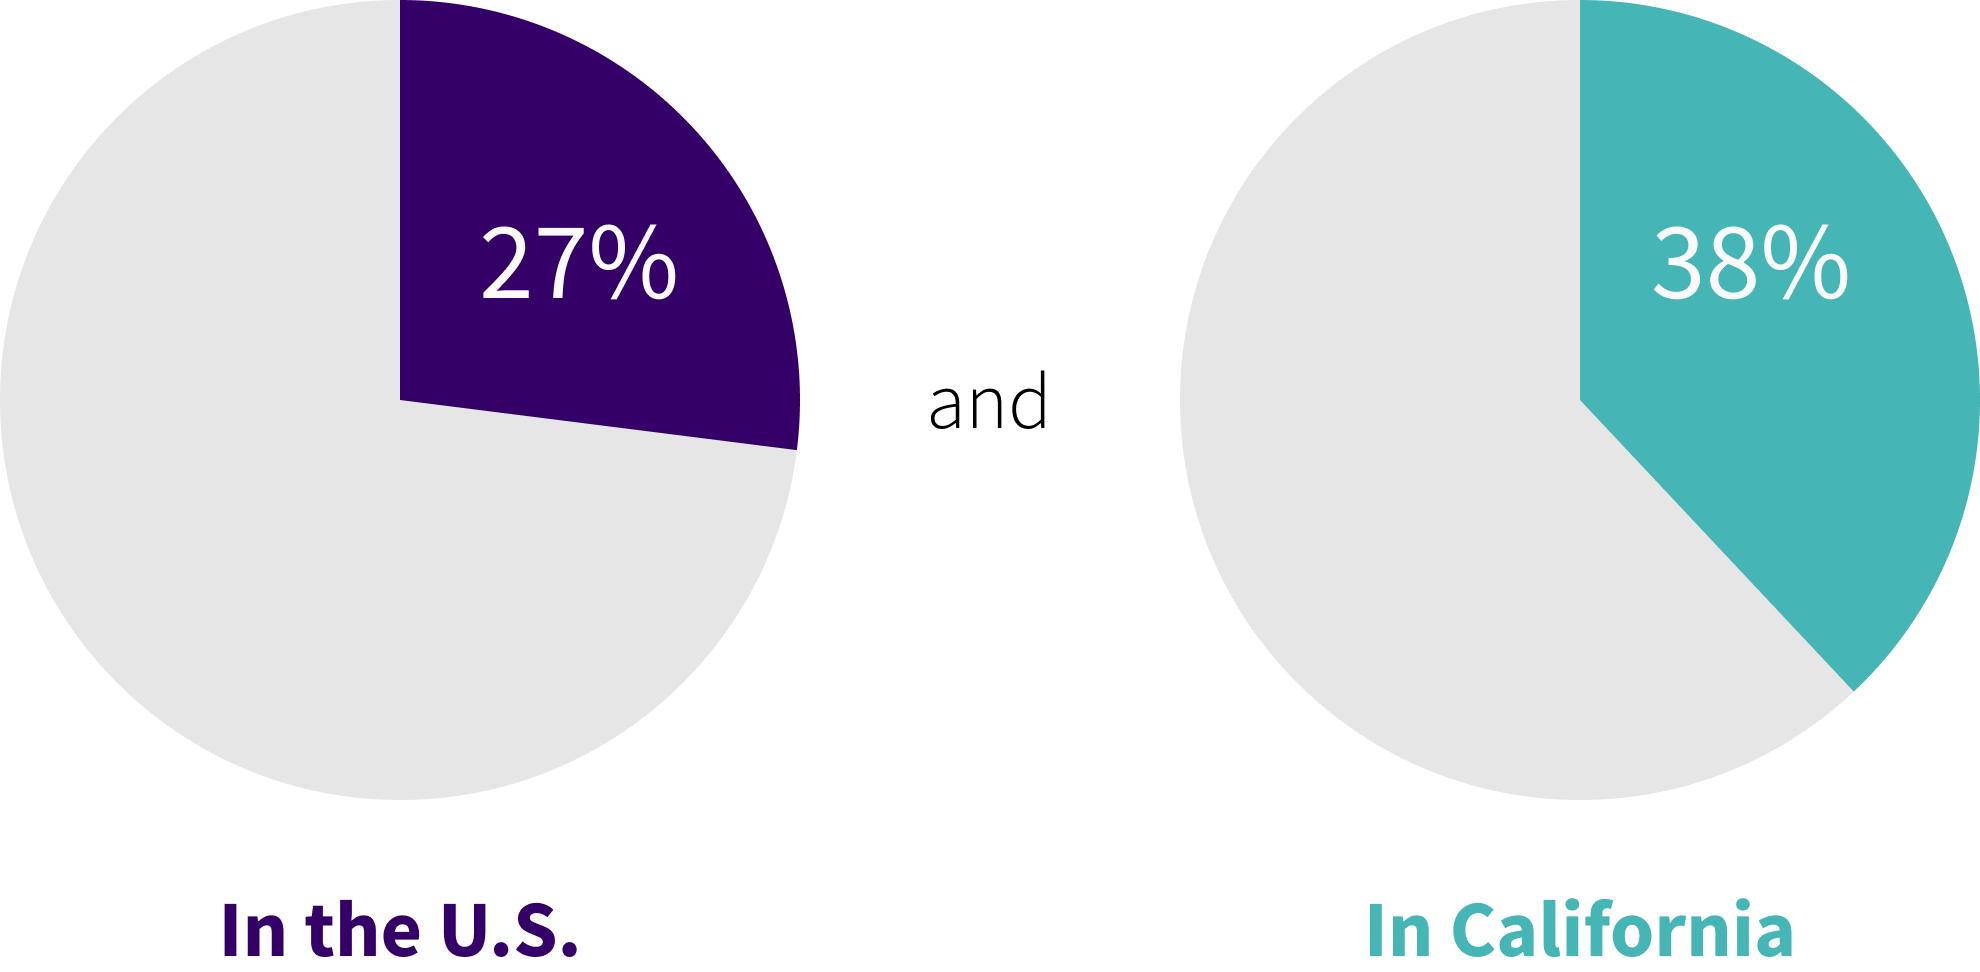
Of all greenhouse gas emissions in 2020, transportation contributed to:

Conventional gas-powered vehicles are fueled by gasoline or diesel and release tailpipe emissions as exhuast.
Tailpipe emissions can vary in composition between vehicles, but contain both greenhouse gasses and air pollutants.

Carbon dioxide makes up 99% of tailpipe emissions of passenger vehicles.

Other harmful air pollutants in vehicle smog: Sulfur dioxide (SO2), Nitrogen oxides (NOx), Carbon monoxide (CO), Formaldehyde (HCHO), Particulate matter (PM).

Air pollutants emitted from transportation is a major contributor to climate change.
Fighting climate change by reducing transportation emissions

There are many strategies to reducing transportation emissions:

Develop sustainable passenger vehicles

Design walkable cities

Shift from passenger vehicles to public transportation

Develop more sustainable methods to generate fuel

Optimize our supply chain routes and chains

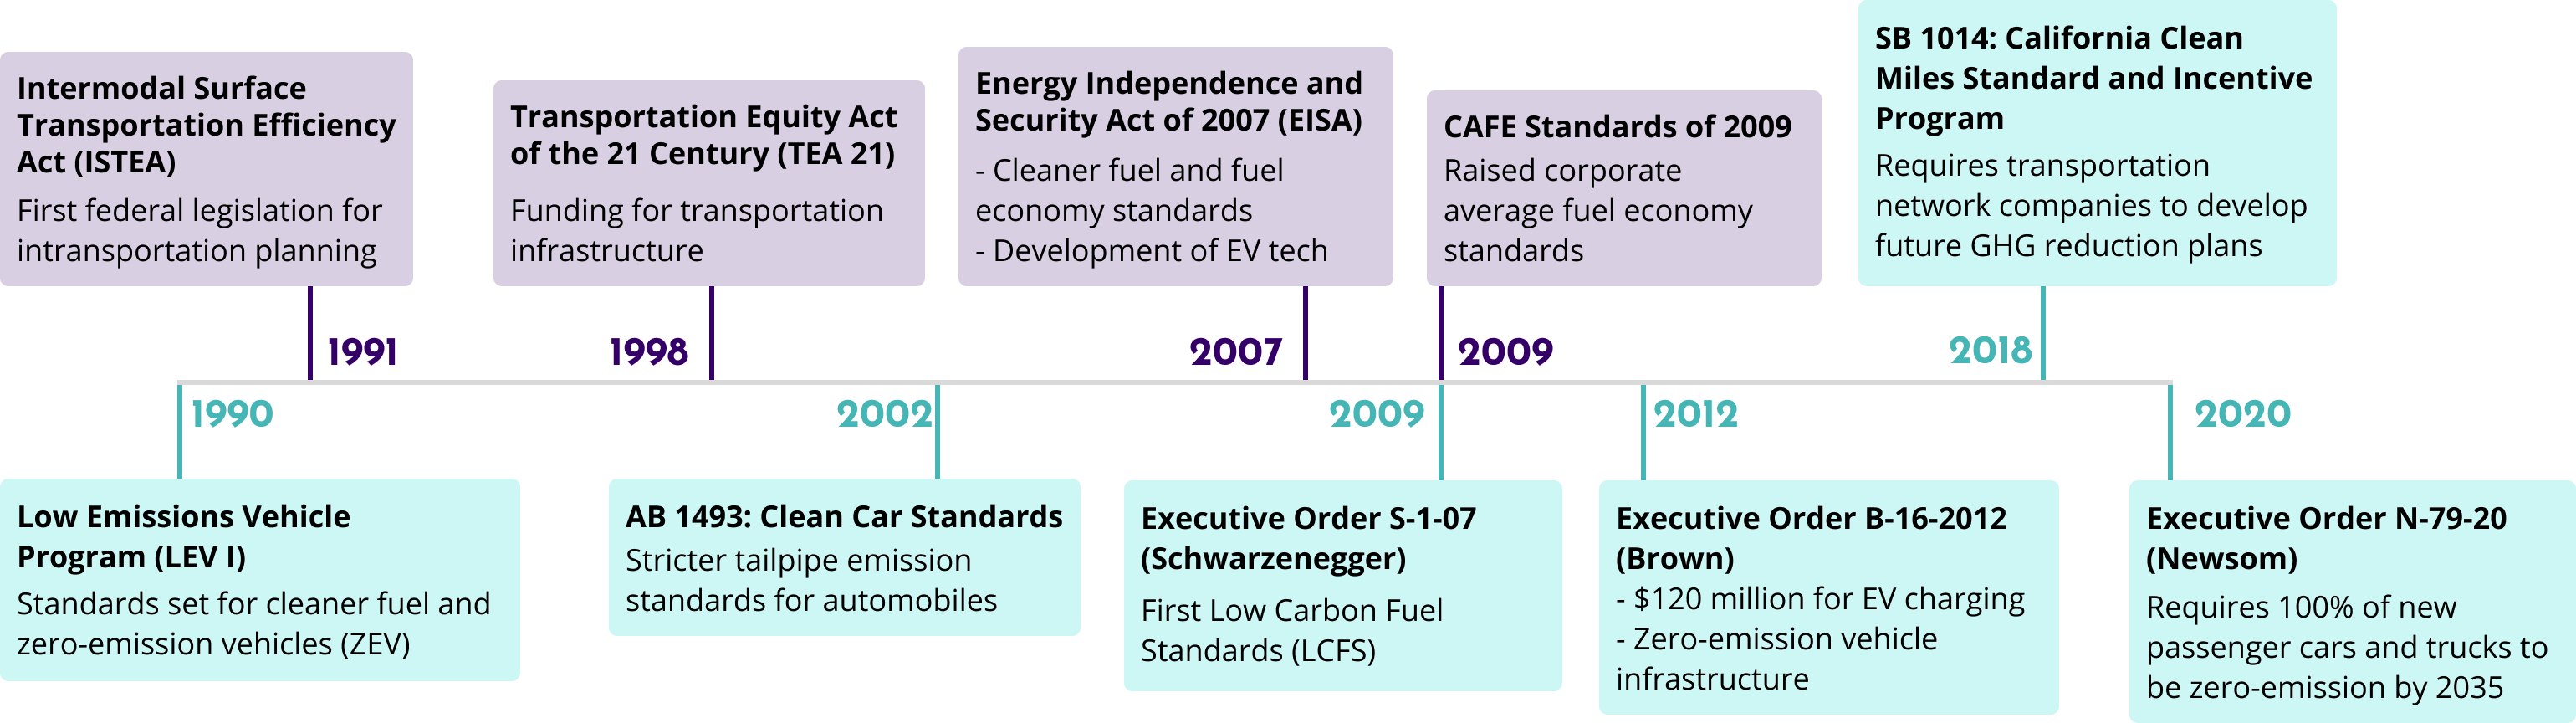
The US focuses on sustainable passenger vehicles


At both a federal and state level, the strategies to reduce transportation emissions have been focused on zero-emission vehicles and electrification.

In 2020, California Governor Gavin Newsom signed Executive Order N-79-20 which mandates that by 2035, 100 percent of all sales of new passenger cars and trucks in California be zero-emission.
In 2021, the Bipartisan Infrastructure Law was signed by President Biden which plans to invest $7.5 billion in EV charging infrastructure and $7 billion in EV battery production.

See the key policies focused around passenger vehicles passed in the past 30 years by the U.S. and California

California's commitment to passing passenger vehicle emission policies has allowed their CO2 emissions to stay below the national average.

When measuring emissions Carbon Dioxide Equivalent (CO2e) is used, which is the measure of any gas's global warming potential relative to carbon dioxide.

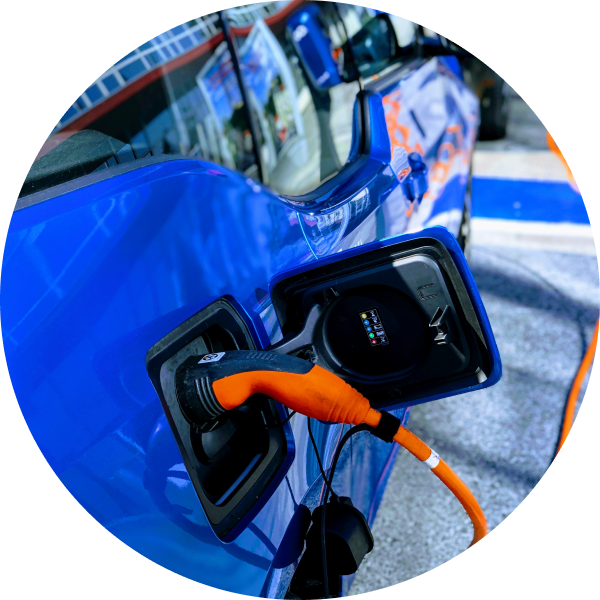
As the US tackles climate change through greener cars, we investigate what emission-free really means.

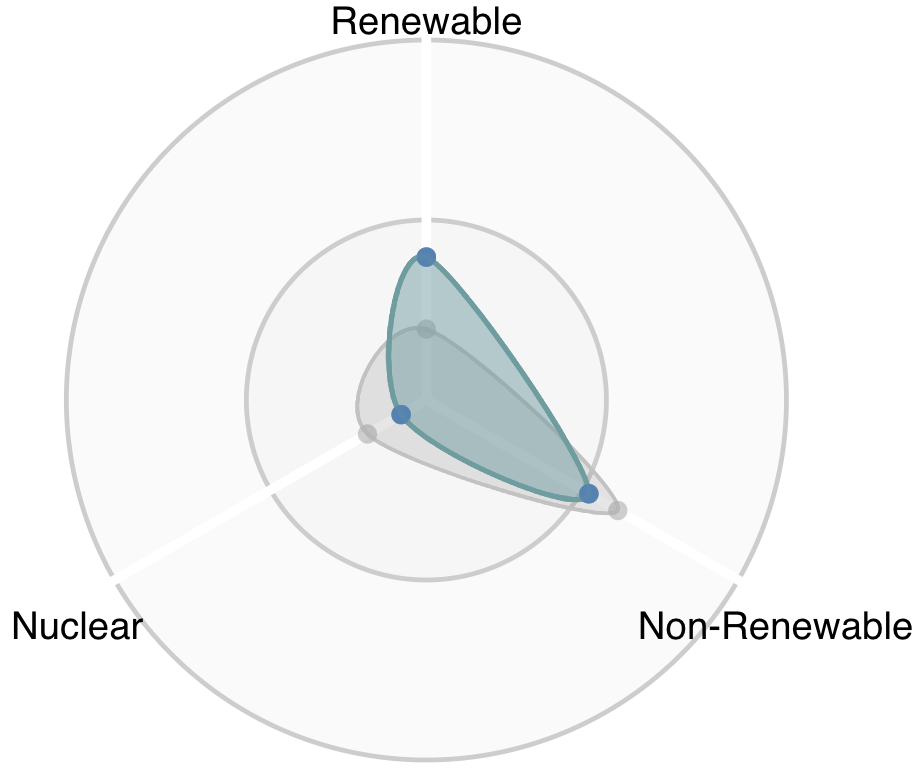
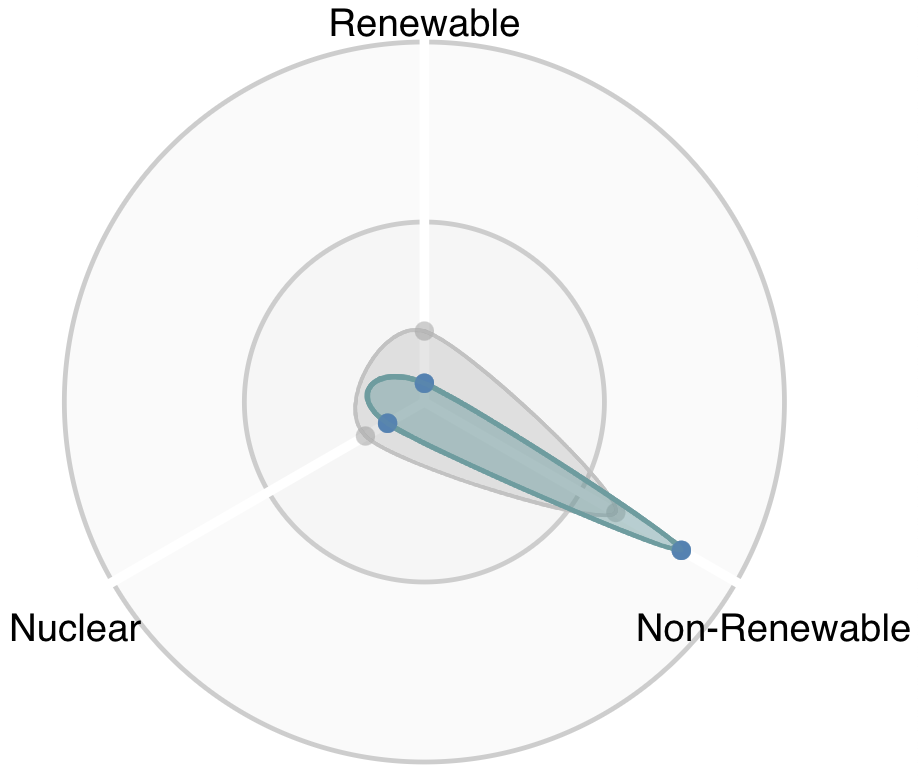
Electric vehicles are said to have zero emissions - which is partially true.


Electric vehicles (EV) are categorized as zero-emission vehicles, but they are only zero-emission in terms of tailpipe emissions. Hidden emissions, such as those from burning fossil fuels to generate electricity for EV charging, still exist.

What is the environmental impact of electric vehicles?

Greener Transportation Alternatives


States have been moving to reduce tailpipe emissions by advocating for alternatives to conventional gas-powered vehicles. California, for one, has pledged that 100% of new vehicles sold in the state must be zero emission by 2035.

Vehicles with Zero Tailpipe Emissions (ZEV)
All Battery Electric Vehicles (BEV)

They store electrical energy to power the motor that is charged through an electric power source.

Fuel Cell Electric Vehicles (FCEV)

Emits water vaper and heat. Energy is stored as hydrogen and it is converted to electricty by a fuel cell.

Vehicles with Tailpipe Emissions
Plug-in-hybrid Electric Vehicles (PHEV)

In electric-mode, they have zero tailpipe emissions, but in ICE mode, they have emissions.

Internal Combustion Vehicles (ICE)

Gas-powered vehicles apply high pressure on fossil fuels in a heat engine, releasing greenhouse gasses as exhaust emissions

Emissions beyond the Tailpipe

Emissions occur throughout a vehicle's lifetime
How do emissions across these life stages differ between ZEVs and ICEs?

The chart on the left shows the emissions breakdown of an all-battery electric vehicle (BEV) and a comparable internal combustion vehicle (ICE).
This example compares a 2023 Subaru Forester AWD (ICE) and a 2023 Subaru Solterra AWD (BEV)

Although the BEV has greater emissions at the beginning of the lifecycle due to battery manufacturing, the ICE has greater lifetime emissions.

Learn more about the phases below.


Explore associated emissions at different phases of a vehicle's lifecycle


Click a phase to learn more!

Production

Where do vehicle lifecycle emissions occur?


Direct and Indirect Emissions

The lifetime emissions of any vehicle span beyond just where the vehicle is used.

Direct emissions are produced when an individual drives a vehicle. These emissions include tailpipe emissions, electricity generation emissions, and fuel transportation emissions.

Indirect emissions are produced from other phases of the vehicle's lifecycle, such as production and end-of-life, may be invisible to the vehicle driver but is experienced strongly elsewhere in the world.


Example: Redwood Material's Global Cathode Supply Chain

Redwood Materials is a manufacturing company based in the U.S. that creates batteries for electric vehicles. We visualized their supply chain process on how they ship and bring materials into their factories.

Click through the map to see how this company's parts are manufactured and transported all over the world.

According to Redwood Materials, materials move over 50,000+ miles before they reach a battery cell factory.
Indirect emissions are being released at each end-point but also released when they are transported from one location to the next.

Global vehicle production = Global Emissions

Emissions when fueling Zero Emissions Vehicles

Electricity used to charge battery electric vehicles (BEVs) and plug-in hybrid electric vehicles (PHEVs) may have associated emissions depending on what energy source was used to generate it.

The combination of sources used to generate electricity is called the Grid Mix. The sustainability of grid mix varies from geographic region to region, and their reliance on fossil fuels (non-renewables) versus other cleaner sources.

Electricity Generation Sources
Renewables

Sources include: wind, hydro, solar, biomass, & geothermal

Nuclear

The U.S. currently has 95 operating nuclear power plants.

Non-renewables

Sources include: fossil fuels, natural gas, coal, & petroleum

Less Emissions from Electricity Generation lead to Less Emissions from EVs

An electric vehicle charged from electricity generated from fossil fuels will have significantly more emissions than electric vehicles charged from electricity generated from renewable sources.

California

California has a lower emissions grid mix. 40% is sourced from renewables such as wind, solar, and natural gas.

Florida

Florida has a high emissions grid mix. 82% is sourced from non-renewables, buring fossil fuels is prevalent here.

Ultimately, location matters. Driving an electric car in the California will have less associated emissions than driving the same electric car in Florida

How clean is your region's electricity generation? Click on the area you live in.

  • EPA (2023). Emissions & Generation Resource Integrated Database (eGRID). U.S. Environmental Protection Agency. Data Updated April 2023. https://www.epa.gov/egrid.
In the United States, electric grids across multiple states are controlled, operated, and monitored by regional transmission organizations. These regional transmission organizations (RTO) are formed and regulated by the Federal Energy Regulatory Commission (FERC), which oversees interstate exchanges of electricity, oil, and natural gas (Federal Energy Regulatory Commission, 2022). Independent system operators (ISO) are also formed through recommendations of FERC and perform similar functions as RTOs, but at a smaller scale and usually within a single state. RTOs and ISOs engage in trading and purchasing electricity across grids to fulfill energy needs or better integrate renewable energy across geographies.

Conclusion

Reducing greenhouse gas emissions and air pollution from transportation can have an impact on mitigating climate change and improving public health.

A solution to reducing transportation emissions depends on many factors like community behavior, urban development planning, legislation, and local culture.

At a national level, the U.S. is tackling this by pushing for a transition from gas-powered vehicles to zero-emission vehicles (electric vehicles).
But at a local level, states and cities are approaching transportation emission reduction by improving and expanding public transportation and/or designing walkable communities.

Ways we can play a role to reduce transportation emissions:

Drive a ZEV

Reduce tailpipe emissions by driving ZEV, no more burning fossil fuels and no air pollution during use.

Drive Less

Reduce transportation emissions by choosing to walk/bike, taking public transporation, or carpooling.

Drive a Smaller Vehicle

A smaller passenger vehicle, like a scooter or compact car, reduces overall transportation emissions.

Where next?

Explore the Emissions of a Vehicle

Calculate the lifetime emissions of any vehicle
with our Emissions Explorer tool.

Emissions Explorer
Learn about Current Barriers to ZEV Adoption

The adoption of zero emission vehicles is more complicated than just people purchasing them.

ZEV Accessibility

Astoria Ho, Clara Hu, Josh Everts -- MIMS '23 Capstone Project